I think it’s the first binary clock on Apple TV.
It’s been nice to share the excitement with other developers who have been preparing their apps for launch day. I’ve missed the launches of iOS (nee iPhone OS) and watchOS, so it’s nice to be ready for tvOS.
Looking forward to seeing where the platform goes.

Maybe a demo is in order.
Stopwatch mode is simply the opposite; it counts up from zero. Much less interaction to deal with but still a nice addition to the clock. I’ve been using these additional modes for over a year and am really excited to get these released.
]]>Once again, fired up Titanium Appcelerator to dig into the Mobile Logger source code. Every time I look at Appcerelator I’m reminded why I have opted to focus on Objective-C. Not going to get into a religious war…it just feels cumbersome. That could just as easily be attributed to my general unfamiliarity with the Titanium Studio and toolchain, since I’m otherwise using Xcode and Objective-C daily. Still, it’s much better now than when I first started Mobile Logger in 2009—using vim because Titanium did not have an IDE (or documentation, for that matter).
Back to Fusion Tables…it’s fairly easy to create a new table and import all the data from logs. Two authenticated calls: one to create the table and receive it’s ID, and another to use that ID with CSV data in a batch import. Once in Google Drive it’s trivial to map the data and play in various ways to chart the data. Nothing special, but here is a quick result from a walk in the park.
For now, I’ve only gotten a one way trip going. Haven’t tried to reconcile changes bidirectionally, or enabled updates to existing tables…but it seems like a promising start. Beta testing the next release of Mobile Logger now. Release likely just after the new year when iTunes Connect reopens. In the meantime, the code is up on github.
]]>Reference:
Dan Hill’s cleanup post
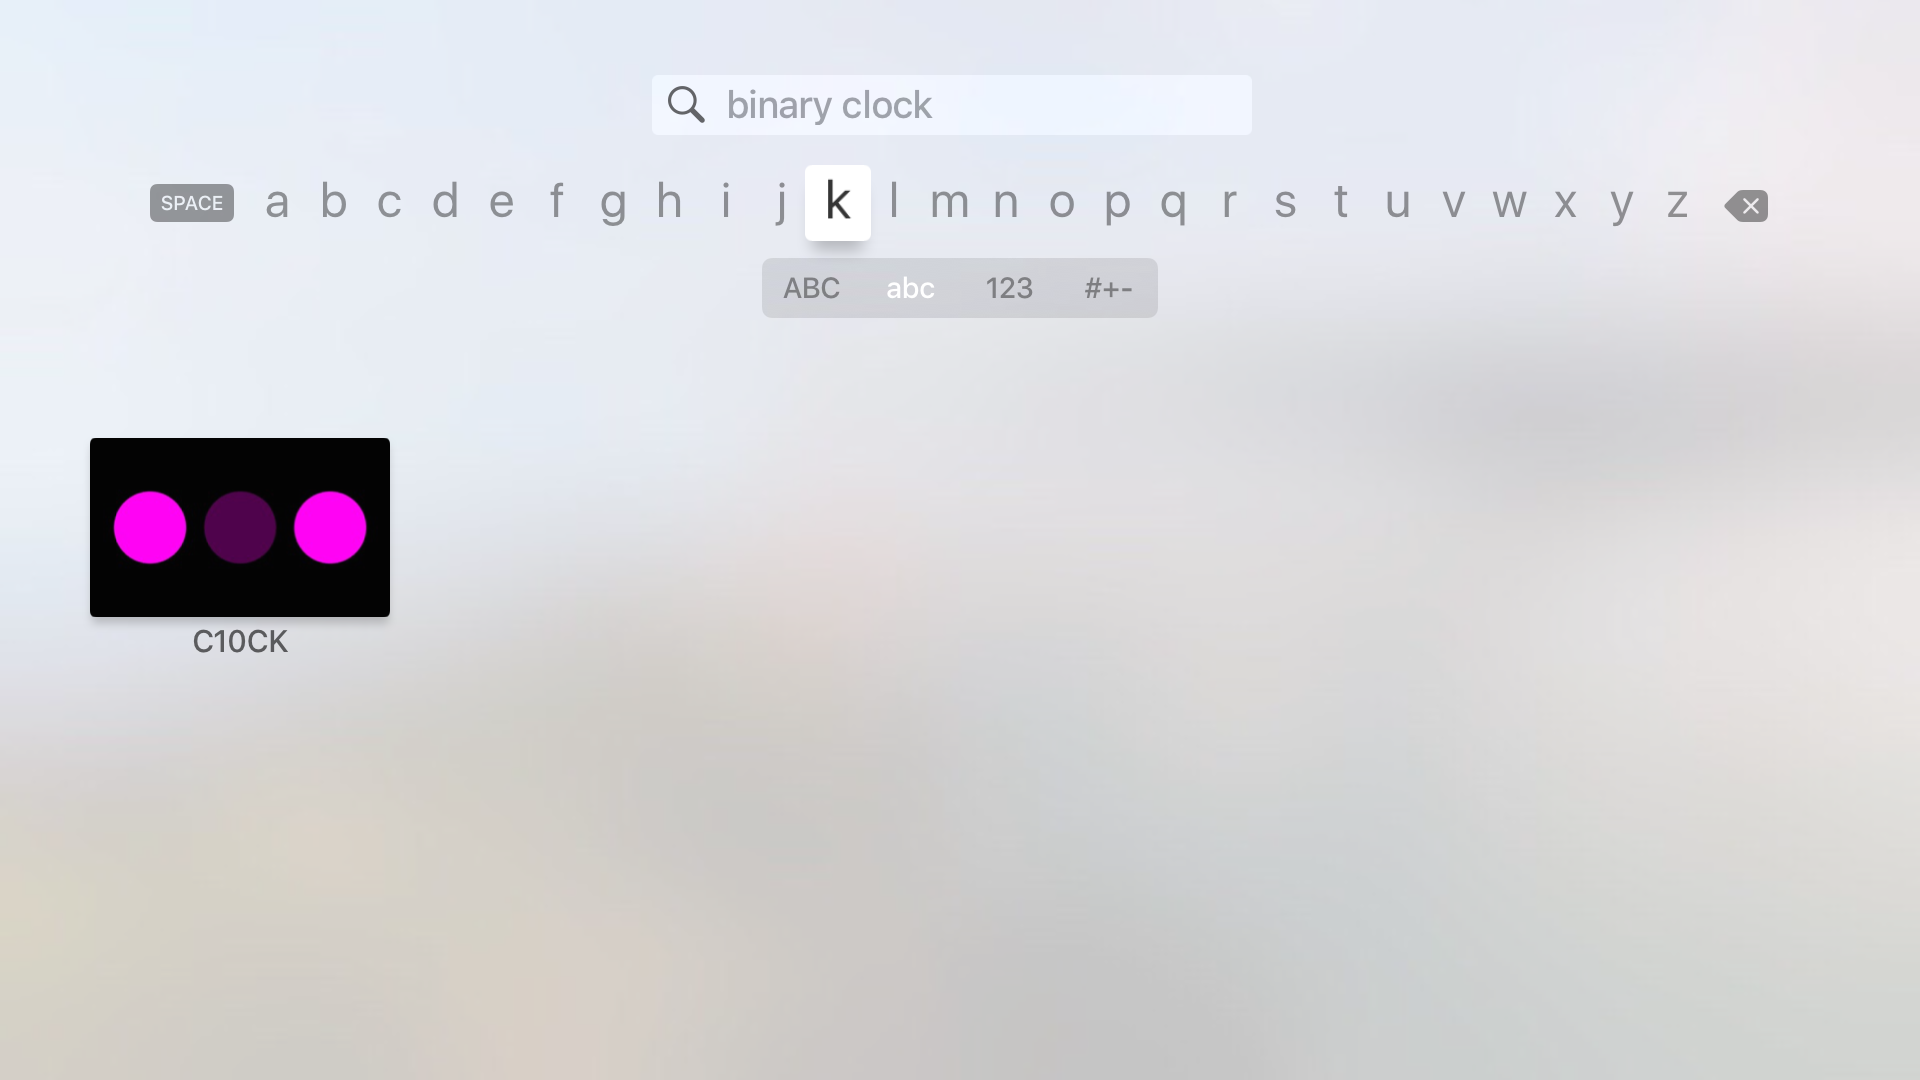
 My second (personal) iPhone app, C10CK, is now available in the App Store. It is a clock which displays time using binary notation – the same way everything is (eventually) stored in a digital computer. I’ve been using a binary clock since a staff member of ITP passed this past year and several alumni recalled stories of the binary clock she kept on her desk and would happily explain to anyone who asked. I now keep a binary clock on my desk and think of her when people ask me what it is.
This app started as a small pet project to work out a simple algorithm for visualizing bit values for integers. Shortly after that was working I added a special learning mode to help me remember the bit values. Eventually, it became an excuse to really play with new features in iOS 4 (gesture recognizers, block based animation, Grand Central Dispatch). I also enjoyed the opportunity to design an app from scratch after nearly a year of deep Cocoa immersion on some rather complex projects at work (I *finally* understand Key-Value-Observing).
 It also was a chance for me to make a universal iPhone / iPod touch and iPad app. It wasn’t so hard to code to take advantage of affordances offered by the larger screen (though, the differences in this app are rather simple). This is also my first (personal) paid app. Many of my reasons have been realized and stated far more eloquently than I could describe – to put it briefly, there is value in my work. A few dollars is mostly a token, but it’s recognition of the time and study which is needed to create something noteworthy. I’ve put in much effort here, even for such a simple app, to design a pleasant visual and user experience with many bits of polish. The audience for this app is limited to be sure (and there’s hefty competition in the app store) but buying the app is a sign of respect for fine craft, and hopefully something the purchaser finds useful, enjoyable or rewarding – it is a clock, after all.
 Recently an open source emulator for AirPort Express / AirTunes was released by James Laird. I’ve been waiting for something like this for a long while to enable remote music playback on my media center from my laptop and iPhone. However, I lack the hardware skills to extract the necessary firmware from the AirPort Express ROM chip. Thanks to James for doing the work and putting out his perl script / c utility. It’s pretty simple to build and run, and the source includes a nice OS X launcher script, but I’m looking for a little GUI widget to easily control it lest someone ‘inadvertently’ decides to send audio to my computer.
I’ve been lately transitioning my iPhone-specific Cocoa knowledge to the desktop; this was a nice opportunity to wrap up the ShairPort scripts in an OS X menu bar widget. The source is available on Github, and you can get the bundled app below. This was made for my specific system, so YMMV.
ShairPortMenu: [download]
]]> For this year’s Philadelphia Fun-A-Day project I decided to write “Hello World” programs. “Hello World” is a traditional programming tradition where a programmer encountering a new language writes a trivial program which displays the phrase “Hello World”.
This introduces the programmer to the basic syntax of the language and demonstrates that their development environment is set up properly to work with that language.
Much of our current environment runs on software, which is generally invisible to us, except when a failure impacts our lives. However, software generally starts as human-readable written text, albeit in a highly defined form using specific vocabulary.
This project attempts to make software visible, in at least a trivial way. The words and structure may differ between languages, but each program is a series of instructions to achieve some end – here to issue a friendly “Hello Fun-A-Day 7!”. Hopefully this can serve to demystify software to some degree, and remind us that software, at some point, has been written by a person.
 The programs here demonstrate a Fun-A-Day variant on Hello World in several languages. I made an effort to explore historical and modern languages, compiled and interpreted languages, console and graphical programs, but avoided esoteric languages which are often difficult to understand by design.
The Association for Computing Machinery has a collection of Hello World programs:
http://www2.latech.edu/~acm/HelloWorld.html
(Note: I’m generally referring to high-level languages, not considering assembly or binary code. If you’ve read this far, and understand what I mean, then you’ll forgive this simplification made for clarity of purpose)
Language: C
#include <stdio.h>

int main(int argc, char* argv)
{
    printf("hello fun-a-day 7! \n");
    return 0;
}

Language: JavaScript
// Use Rhino intrepreter to run in a shell
// http://www.mozilla.org/rhino/download.html

function sayHello() {
    print('Hello Fun-A-Day 7!');
};

sayHello();

Language: Arduino / Wiring (C++)
#include "WProgram.h"

// prototypes
void blink(int n, int d);

#define unit 100
void dot(int n);
void dash(int n);
void gap();
void pause();
void space();

// variables
int ledPin = 13;                      // LED connected to digital pin 13

void setup(){
    Serial.begin(9600);               // opens serial port, sets data rate to 9600 bps

    pinMode(ledPin, OUTPUT);          // sets the digital pin as output

    // print a friendly message to the serial console:
    Serial.println("-------------------");
    Serial.println(" Hello Fun-A-Day 7");
    Serial.println("-------------------");
}

void loop(){
    // display "Hello Fun A Day 7" in morse code:
    dot(4); pause();                  // H
    dot(1); pause();                  // E
    dot(1); dash(1); dot(2); pause(); // L
    dot(1); dash(1); dot(2); pause(); // L
    dash(3);                          // O
    space();
    dot(2); dash(1); dot(1); pause(); // F
    dot(2); dash(1); pause();         // U
    dash(1); dot(1);                  // N
    space();
    dot(1); dash(1);                  // A
    space();
    dash(1); dot(2); pause();         // D
    dot(1); dash(1); pause();         // A
    dash(1); dot(1); dash(2);         // Y
    space();
    dash(2); dot(3);                  // 7
    space();
    dot(3); dash(1); dot(1); dash(1); // end-of-message
    space();space();space();
    space();space();space();
}

void blink(int n, int d){
  for (int i=0;i<n;i++)
  {
    digitalWrite(ledPin, HIGH);
    delay(d);
    digitalWrite(ledPin, LOW);
    delay(unit);
  }
}

// timing as specified by International Morse Code
void dot(int n) {
    blink(n, unit);
}

void dash(int n) {
    blink(n,3*unit);
}

void gap() {
    delay(unit);
}

void pause() {
    delay(3*unit);
}

void space() {
    delay(7*unit);
}

int main(void)
{
    init();
    setup();
    for (;;)
        loop();
    return 0;
}
Language: Perl
# Fun-A-Day 7
# Perl
#

sub sayHello {
    printf("Hello Fun-A-Day 7!\n");
}

sayHello;

Language: Cobol
 IDENTIFICATION DIVISION.
      PROGRAM-ID. HELLO-WORLD.
      PROCEDURE DIVISION.
          DISPLAY 'Hello Fun-A-Day 7!'.
          STOP RUN.
Language: BASIC
10 print "Hello Fun-A-Day 7!"
20 goto 10
Language: C++
#include <iostream>
using namespace std;

class FunADay {
    public:
        FunADay () {};
        void sayHello() {
            cout << "Hello Fun-A-Day 7!" << endl;
        };
};


int main()
{
    FunADay *fad = new FunADay();
    fad->sayHello();
    delete fad;

    return 0;
}

Language: bash
#!/bin/bash
#
# Fun-A-Day 7
#

echo 'Hello Fun-A-Day 7!'

Language: Processing
// Fun-A-Day 7
// Processing example

void setup()
{
  // initialize the canvas and set some paramaters
  size(100,100);
  smooth();
  noStroke();
}

void draw()
{
  // partially "erase" the previous screen
  // by drawing a semi-transparent, black rectangle on top
  fill(0,55);
  rect(0,0,width,height);

  // draw another ellipse
  fill(204);
  float x = random(width); float y = random(height);
  ellipseMode(CENTER);
  ellipse(x,y,20,20);

  // be friendly
  sayHello();
}

void sayHello()
{
  println("Hello Fun-A-Day 7!");
}
Language: Python
# Fun-A-Day 7
# python example
#
# be sure to mind your indentation!

def sayHello():
    print "Hello Fun-A-Day 7!"

sayHello()
Language: Ruby
class FunADay
    def sayHello()
        print "Hello Fun-A-Day 7!"
        print "\n"
    end
end

fad = FunADay.new
fad.sayHello
Language: Java
package net.robertcarlsen;

public class FunADay {
	public static void sayHello()
	{
		System.out.println("Hello Fun-A-Day 7!");
	}

	public static void main(String[] args) {
		sayHello();
	}

}
Language: C#
/* Fun-A-Day 7
 *
 * C#
 */

class HelloFunADay
{
  static void Main () {
     System.Console.Write("Hello Fun-A-Day 7!\n");
  }
}
Language: sed (bash)
#!/bin/bash

# This is just a simple example of using sed
# for find and replace.
# echo will just spit out the quoted text
# '|' is the pipe operator, and sends the output from
# echo to the next program, in this case sed
# sed is using the 's'earch operation
# 's/find stuff here/replace it here/'
# the parentheses match stuff that we can refer to later as \1
# .* means match any character, zero or more repeated times
# but it won't include the literal phrase " World" because that's
# specifically written in the match expression.

echo "Hello World" | sed 's/\(.*\) World/\1 Fun-A-Day 7!/'
Language: Lisp
;;; Fun-A-Day 7
;;; Robert Carlsen
;;;
;;; Lisp version

(defun sayhello ()
  "the basic hello" ; make sure to be friendly
  (format t "Hello Fun-A-Day 7!")
)
Language: php
<?php
    printf("Hello Fun-A-Day 7! \n");
?>
Language: Go
package main

import "fmt"

func main() {
	fmt.Println("Hello, Fun-A-Day 7!")
}
Language: Objective-C / Cocoa
(There is far too much boilerplate code and dependent project files to paste here, but this is the bit which drives some simple interaction – displaying an alert if you tap the badger image several times)
@interface Fun_a_Day7ViewController : UIViewController {
}

@property(nonatomic,retain)IBOutlet UILabel *badgerLabel;
- (IBAction)badger:(id)sender;
@end

@implementation Fun_a_Day7ViewController
@synthesize badgerLabel;

static int count = 0;

- (IBAction)badger:(id)sender;
{
    self.badgerLabel.hidden = !self.badgerLabel.hidden;

    if(++count > 4) {
        UIAlertView *alert = [[UIAlertView alloc] initWithTitle:@"Badger"
                                                        message:@"No, seriously...quit badgering me!"
                                                       delegate:nil
                                              cancelButtonTitle:@"Stop it"
                                              otherButtonTitles:nil];
        [alert show];
        [alert release];
        count = 1;
    }
}
@end
Language: R
# Fun-a-day 7
# R language for statistical computing
#
fad_peeps <- c(43,64,72,84,74,68)
years <- seq(2010-5,2010)
data.frame(years,fad_peeps) -> fadData
fadData
#  years fad_peeps
#1  2005        43
#2  2006        64
#3  2007        72
#4  2008        84
#5  2009        74
#6  2010        68
require(ggplot2)
qplot(years,fad_peeps,fadData) + geom_smooth()

Update: The script has been updated, thanks mostly to the prompting of fopen2003 in the comments below. I’ve successfully tested the resulting libs in both Simulator and an iPhone 4 (both at iOS4.x) using the PocketOCR project.
After many requests, I finally got around to looking into updating the build script to cross-compile tesseract ocr v3 for use with iPhone. Here’s the script. It seems to build the static, fat library without error. I haven’t tried to update my app to use it yet, so I really don’t know if it even works. Let me know in the comments if it actually does indeed work.
- Check out the svn source of tesseract: http://code.google.com/p/tesseract-ocr/source/checkout
- Copy this script into the source directory and run from there
- Profit???
The libraries will be in a directory named “outdir”
#!/bin/sh
# build_fat.sh
#
# Created by Robert Carlsen on 15.07.2009. Updated 24.9.2010
# build an arm / i386 lib of standard linux project
#
# initially configured for tesseract-ocr v2.0.4
# updated for tesseract prerelease v3

outdir=outdir
mkdir -p $outdir/arm $outdir/i386

libdirs=( api ccutil ccmain ccstruct classify cutil dict image textord training viewer wordrec )
libs=( api ccutil main ccstruct classify cutil dict image textord training viewer wordrec )
count=${#libdirs[@]}


make distclean
unset CPPFLAGS CFLAGS LDFLAGS CPP CXX CC CXXFLAGS DEVROOT SDKROOT LD

export DEVROOT=/Developer/Platforms/iPhoneOS.platform/Developer
export SDKROOT=$DEVROOT/SDKs/iPhoneOS4.1.sdk
export CFLAGS="-arch armv6 -pipe -no-cpp-precomp -isysroot$SDKROOT -miphoneos-version-min=3.0 -I$SDKROOT/usr/include/"
export CPPFLAGS="$CFLAGS"
export CXXFLAGS="$CFLAGS"
export LDFLAGS="-L$SDKROOT/usr/lib/"
export LD="$DEVROOT/usr/bin/ld"
export CPP="$DEVROOT/usr/bin/cpp-4.2"
export CXX="$DEVROOT/usr/bin/g++-4.2"
export CC="$DEVROOT/usr/bin/gcc-4.2"
./configure --host=arm-apple-darwin
make -j3

index=0
while [ "$index" -lt "$count" ]
do
    cp ${libdirs[index]}/.libs/libtesseract_${libs[index]}.a $outdir/arm/libtesseract_${libs[index]}_armv6.a
    ((index++))
done


make distclean
unset CPPFLAGS CFLAGS LDFLAGS CPP CXX CC CXXFLAGS DEVROOT SDKROOT LD

export DEVROOT=/Developer/Platforms/iPhoneSimulator.platform/Developer
export SDKROOT=$DEVROOT/SDKs/iPhoneSimulator4.1.sdk
export CFLAGS="-arch i386 -pipe -no-cpp-precomp -isysroot$SDKROOT -miphoneos-version-min=3.0 -I$SDKROOT/usr/include/"
export CPPFLAGS="$CFLAGS"
export CXXFLAGS="$CFLAGS"
export LDFLAGS="-L$SDKROOT/usr/lib/"
export LD="$DEVROOT/usr/bin/ld"
export CPP="$DEVROOT/usr/bin/cpp-4.2"
export CXX="$DEVROOT/usr/bin/g++-4.2"
export CC="$DEVROOT/usr/bin/gcc-4.2"
./configure
make -j3

index=0
while [ "$index" -lt "$count" ]
do
    cp ${libdirs[index]}/.libs/libtesseract_${libs[index]}.a $outdir/i386/libtesseract_${libs[index]}_i386.a
    ((index++))
done


# are the fat libs making the bundle too big?
index=0
while [ "$index" -lt "$count" ]
do
    /usr/bin/lipo -arch armv6 $outdir/arm/libtesseract_${libs[index]}_armv6.a -arch i386 $outdir/i386/libtesseract_${libs[index]}_i386.a -create -output $outdir/libtesseract_${libs[index]}.a
    ((index++))
done

unset CPPFLAGS CFLAGS LDFLAGS CPP CXX CC CXXFLAGS DEVROOT SDKROOT
]]>Currently, the last feature holding up release is the post log upload…there are intermittent timeouts occurring and I’d like to determine if there is a lightweight way to mitigate them.
This upcoming release will likely change the “real-time” uploading to opt-in. There are two primary reasons: conserve significant battery life and to alleviate the server load from new data.
The battery savings are great…I’ve gone from close to 20% to less than 10% use over a 35 minute ride.
I’m getting low on space on the server, with about 550 hours of data logged – which is awesome – thanks to everyone who has shared their log data. However, I haven’t yet had an opportunity to visualize it and am feeling a bit overwhelmed by it. Hopefully this will throttle that a bit.
So, that’s the status…stay tuned!
]]> Got two new features rolled into Mobile Logger at once…raw database export and zip compression. This sounds exciting, right?!
Actually, it’s pretty cool and useful. Some of these new export formats (GC and GPX, I’m looking at you) are XML-based and thus quite verbose. What was a manageably small CSV file or JSON string has become inflated much larger from all the tagging in these formats. Exporting a log in one of these formats means having send a doubly large file (approx. 300kB -> 600kB). However, all the repeated tags makes them great candidates for zip compression. Those logs are about 70kB afterwards. So there’s that.

Secondly, I have been thinking of making it easy to get the raw database off the device. It’s a good idea for backup and since it’s sqlite, advanced tinkerers could run custom queries and maybe figure out neat things…like where do I ride fastest, generally? To that end I’ve added a row in the settings panel to e-mail the raw database directly. This is what really pushed the compression initiative forward. The db on my device is 14MB, which is difficult for the phone to e-mail (lots of memory warnings and it took forever to send). Compressing the file makes it about 3MB, which is still large but quick enough over WiFi.
However, making the raw database available does expose a pretty big shortcut that I took when first putting the app together. All the sensor/log data is stored in the db as big JSON strings. This made it really easy to save locally and send to couchDB on the fly while a log was being recorded. Also, it didn’t matter what data I was storing – couchDB is schema-less and it was nice to not have to define a local schema. The huge downside is that every export feature parses the JSON strings and then formats each datum as necessary…it takes a bit of work on the phone’s part. Further, it makes it very difficult to use SQL queries to inspect the log data…aggregates, relationships…all that would have to be parsed into memory first. Ugh. Not happening.
So, on the horizon I suppose is gutting the data model and implementing the schema properly. The sensors on the iPhone aren’t changing – at least until we get to connect to external sensors ;) .
As always, code is on github.
]]>