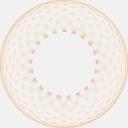
I was messing around with generative drawing for the Processing class I’m teaching…and started playing with spirographs (my bigger brain, ie. Google and Wikipedia, reveals that they are called hypotrochoids).
The algorithms are quite simple:
x = (R - r) * cos(theta) + d * cos((((R-r)/r)*theta));
y = (R - r) * sin(theta) - d * sin((((R-r)/r)*theta));
The results are neat, and mapping the basic variables to keys or the mouse provide a nice way to alter the drawing through iteration. Coupled with the PDF library and some extra code the graphs can be printed out at large sizes. Here are a couple.


Leave a Reply
You must be logged in to post a comment.