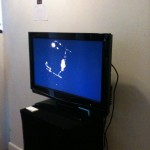
 The 2009 ITP Winter Show is Sunday and Monday, December 20–21. The first visualization of my ongoing bicycle data logging project is on display under the title “seismi{c}ycling“.
This visualization traces the routes I rode throughout the fall, highlighting big bumps. Areas of New York which caused me to experience lots of bumps begin to glow bright red.
The show is a great time; I’d highly suggest coming to see the myriad of projects this year. There’s a online guest book with project map at ITPGuestbook.
Leave a Reply
You must be logged in to post a comment.