 (this is an initial report for a longer post)
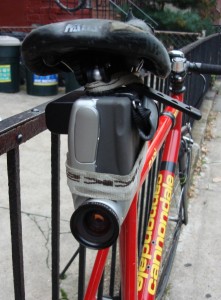
in conducting field research for the CycleSense bicycle proximity sensor i’m looking to gather data about actual proximity events while riding and to correlate these events with video documentation and personal annotation from the test subject…probably just me.
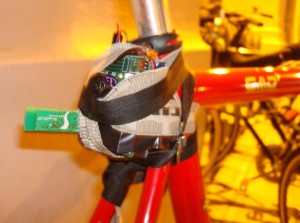
to that end, i’ve worked on rigging up a data logging solution for the sensor package. there was some information on using bluetooth enabled mobile phones as a storage device, communicating to a bluetooth module such the blueSMiRF attached to a microcontroller. in this case, an ultrasonic rangefinder is read by an Arduino which sends the range values through the blueSMiRF to a nokia phone.
(there was much struggle getting the blueSMiRF modules to function, which i’ll document later, and may have been caused by faulty modules)
 i had been directed to look at dan o’sullivan’s data logger java midlet application, and spend a while trying to get it to work. ultimately, it never successfully connected to my bluetooth module. also, downloading the data was a bit of a process, having to use a special application on the desktop computer to access and unpack the specially formatted database in which the midlet application stores the data.
frustrated that every turn seemed to make things more difficult…i decided on a more radical approach…just write another data logger application in a language i’ve never used (python) on a platform i don’t develop for (symbian s60). there were several things working in my favor with this…python is a (subjectively) really easy and simple language that has good documentation (with a great sense of humor) and python for the s60 has been open sourced and blessed by nokia. also, using this method i could write the data file to the memory card in a simple CSV format and transferring the data is as easy as dropping the card into a reader and copying the file to the desktop (yes, i know…as easy as using the already made logomatic)
in the end it worked great and i have an initial test run of data from my ride home. it’s logging a sample every second, and will be capable of much more once i work out how to properly time stamp those samples. parsing the csv file and visualizing the data with processing will be fun, although the project isn’t about visualizing the data…so i’ll have to be mindful to focus on using the visualization to illustrate various traffic conditions.
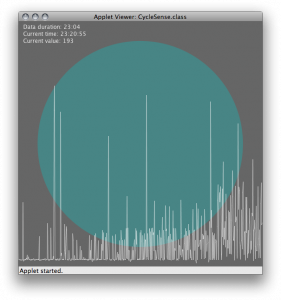
for the time being, i have a simple grapher sketch to step through the values so i can look for patterns. nothing yet…although i can already see that the raw data is going to be noisy and will have to be smoothed out significantly. i think that this type of sketch will be very useful when combined with a synchronized video and user annotations. it would be really nice to be able to scrub through the data to identify the sensor readings at various conditions. this will be important to really isolate the most pressing moments which need alerts and to minimize false positives.
i’ve also done some research into feedback, and REALLY want to include haptic, physical response. i’ve been warned of the dangers of vibration near the spine and have to do more investigation into these concerns. i’m as interested in a visual feedback system, although that remains a solid fallback.
more to come.


Leave a Reply
You must be logged in to post a comment.