 (note: I’m awaiting the HR sensor, this is mostly outward forces)
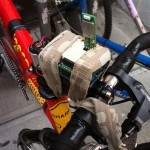
I’m logging the acceleration forces at the handlebars of my bicycle while riding through New York City. The body has roughly three contact points with a bicycle, the hands at the handlebars, the “seat” at the saddle, and the feet at the pedals. The downward force of the rider’s weight and pedaling force and the upward forces of the bicycle rolling over uneven ground are distributed over these three points. I was interested to see just what kind of forces are “pushing back” that I may not be aware of, myself lost in the act of simply keeping the bicycle upright and safely navigating through traffic.
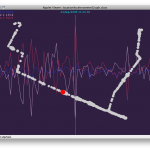
 To contextualize the raw accelerometer data I also tracking GPS location and eventually geocoding the raw data in software. The bicycle sensors are being transmitted via Bluetooth to a mobile phone and the data is logged with a custom written (but now open-source!) python script. Below is the first draft of the visualization.
I intend to add more sensors to record internal forces to see if there is a physiological response (HR, GSR, breathing, pressure on contact points) to external factors such as speed, traffic / road / weather conditions, time-of-day etc.
Video demonstration of the initial visualization.
Leave a Reply
You must be logged in to post a comment.