The research presented by Leslie Vosshall et al regarding larval olfactory response (ie. smell) provides several challenges in visualizing an invisible sense. There does seem to be evidence that the larvae are drawn to the higher areas of concentration, but how to illustrate that pull?
The illustrations in the research’s published work depict greater concentrations of odor mapped to brightness/saturation of a color gradient. This does provide a feeling that something changes throughout the space, but doesn’t give insight as to why the larvae move toward the lighter areas.
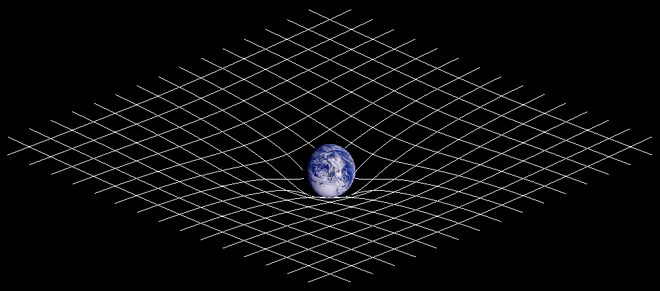
I started thinking about visualizations of the Space-Time Curvature spurred by Einstein’s Theory of Special Relativity. Often it’s depicted as a plane deformed by various events.

Illustrations like these help me to understand invisible phenomena like gravity. I don’t have to understand how gravity functions to be aware of it’s consequence. Likewise, I don’t have to comprehend the mechanism behind smell or odor to understand that I simply need to follow the intensity of an appealing odor to reach it’s source.
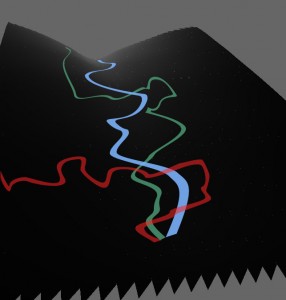
Below is a brief idea for the smell data visualization. The intensity of the odor is mapped to a deformed plane, with more intense odor depressed vertically. I’m hoping that our familiarity with gravity will create a natural understanding that larvae with intact olfactory organs (blue) will simply follow the scent “downhill”. I have yet to reconcile how to explain why larvae with modified (green) or non-functioning (red) olfactory organs will resist the “downward pull” of the scent – or how to depict that they seem unaware of it.
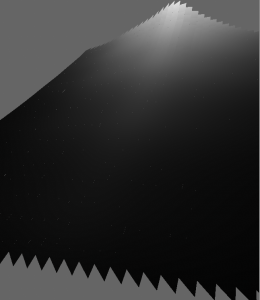
This is an inverted mapping of intensity, with “higher” areas representing greater concentration of odor.


Leave a Reply
You must be logged in to post a comment.