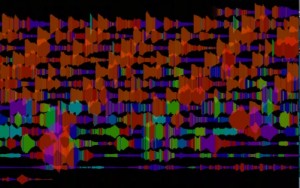
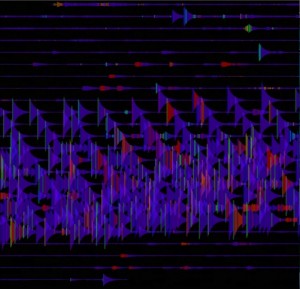
Progress on the sound sketch. I’m not satisfied with the sketch yet, but I’ve attached two screenshots of the result so far. The applet and source code are available.
Of the assignment description, the final sentences drew my attention:
“How would you explain it to someone who’s deaf. What is purpose of visualizing sound differently? Could you think of it as drawing with your voice?”
I happened to be sitting on Astor eating a sandwich after class and started thinking about these things. My initial notes:
Sound is time based…display the history (as a line, etc.)? Only show the immediate samples?
Sound is also layered and it is spatial. Think of a city street. There are sounds in all directions and distances. Is it the amplitude (volume) which is a clue to distance, or is it something like parallax?
Properties of digital sound: frequency, amplitude, sample rate, sample size, channels (stereo)
—
As a drawing tool: sound volume is really changes in pressure. An airbrush or paintbrush change the thickness of their strokes based on pressure. Can the drawing tool use sound amplitude in place of physical pressure?How about opacity? Use the same technique? Have to hum lightly to make any mark at all?
What about color? Map a range of frequencies to a spectrum of color? Human voice, piano, etc? This is less useful in a noisy environment with many overlapping sounds.
I have started to create a drawing tool, but in the iterative process I have gone to a representation of the microphone’s sound in horizontal rows. Amplitude determines the height of each vertical line, the pitch of the loudest sample determines the hue. I have an alternate version using opacity to represent pitch. There’s much more experimentation to do.


Leave a Reply
You must be logged in to post a comment.