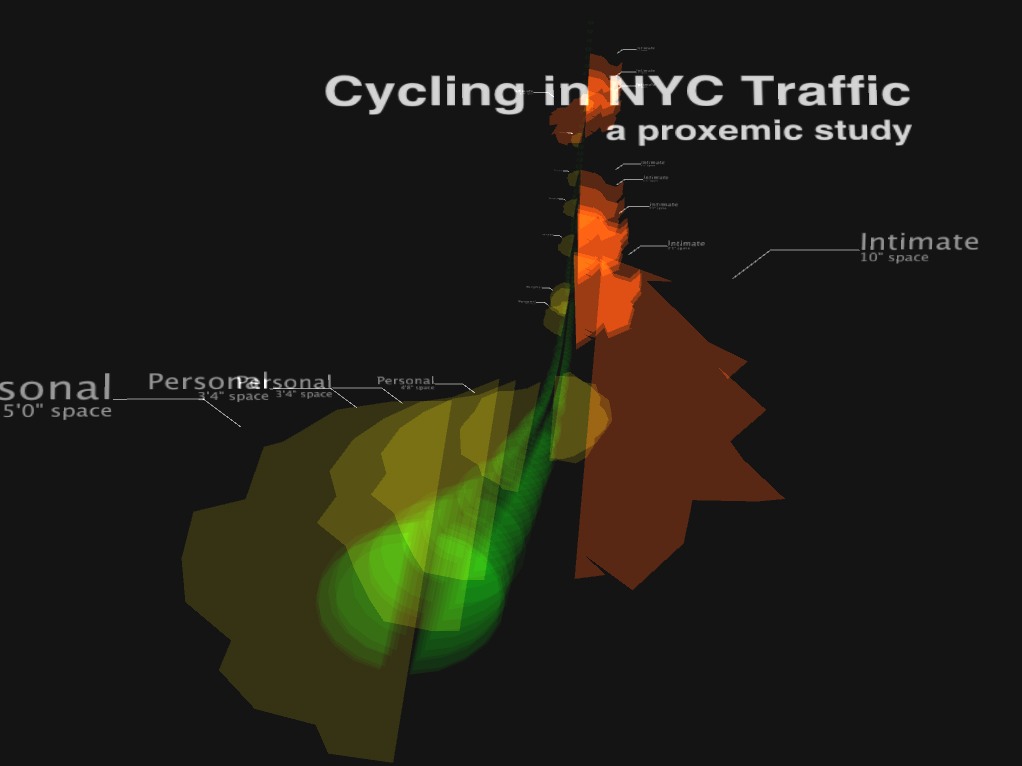
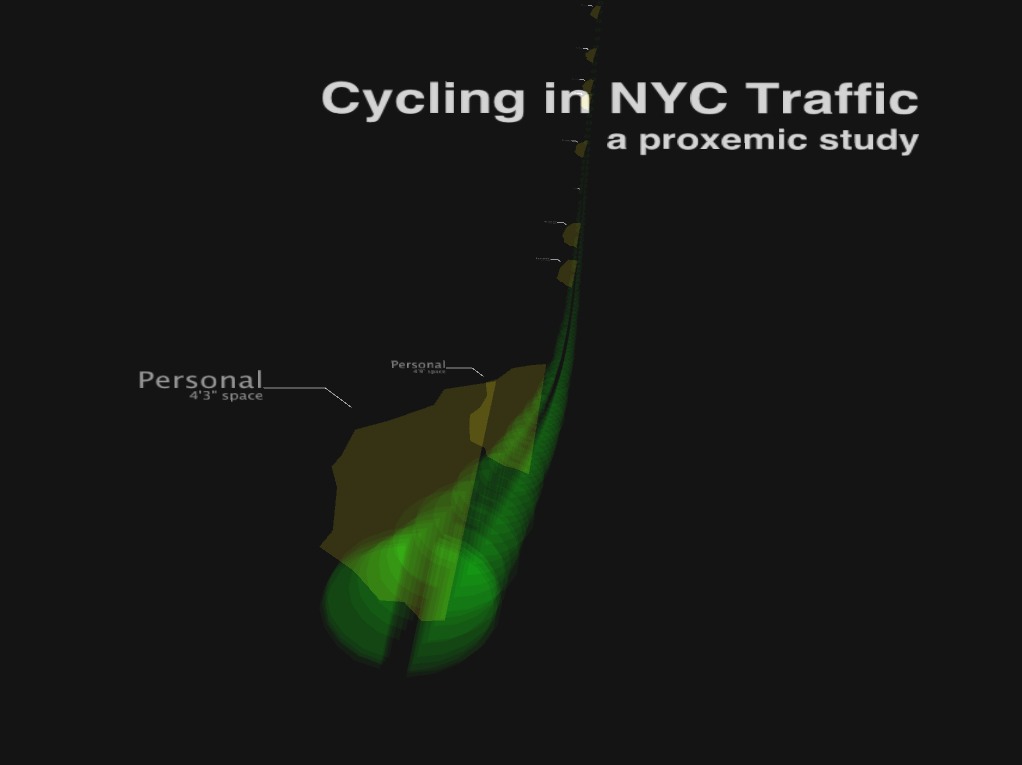
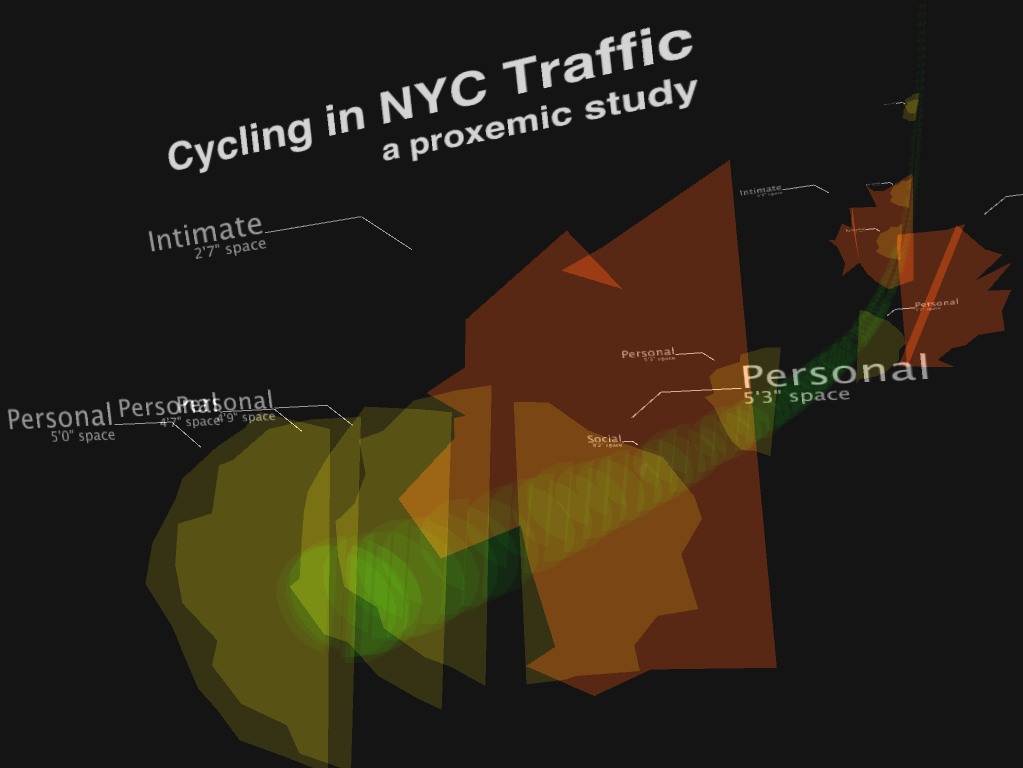
In conducting research for the CycleSense bicycle traffic proximity system I gathered data about the amount of space behind a bicycle rider traveling through typical New York City traffic at various times and locations. The initial visualization of this data was to graph the distances over time to look for specific events that the system would need to detect in order to be useful. I cross-referenced the space data with video taken on the same rides
While the graphing application was certainly useful in tuning the system, it was confusing for viewers to understand. I don’t really view this as a fault of the design since it was intended to fulfill a specific need in developing the project. However, I really would like to convey the moments of traffic’s encroachment into a cyclist’s personal space.
I was directed to look into the field of proxemics and the work of Edward Hall by our “Visualizing the Five Senses” professor, Jane Nisselson (Virtual Beauty). What interested me most was the depiction of personal space into four categories: Intimate, Personal, Social and Public. Although this work primarily seems to deal with intrapersonal relationships I wondered if the categories could be used to express the space around a cyclist…specifically to communicate the space to non-cyclists.
Here are several images of the resulting visualization. The project is animated – I’ll an example of the movement online in the next few days, with the source code.


Leave a Reply
You must be logged in to post a comment.